Before a Storm . . .
Before a storm even threatens your area, there are some things that you should do to be prepared and not have to make snap decisions in the middle of a storm.
Learn How Long it Takes to Evacuate From Your Area
Your local or county Emergency Management office can help you determine a rough estimate of how long it will take you to get out of your area and to safety. This time is critical to know so that you aren’t stuck in the storm before you can get to safety. This should be a time in hours before you are stuck sheltering in place.
Pick Routes Out of Your Area
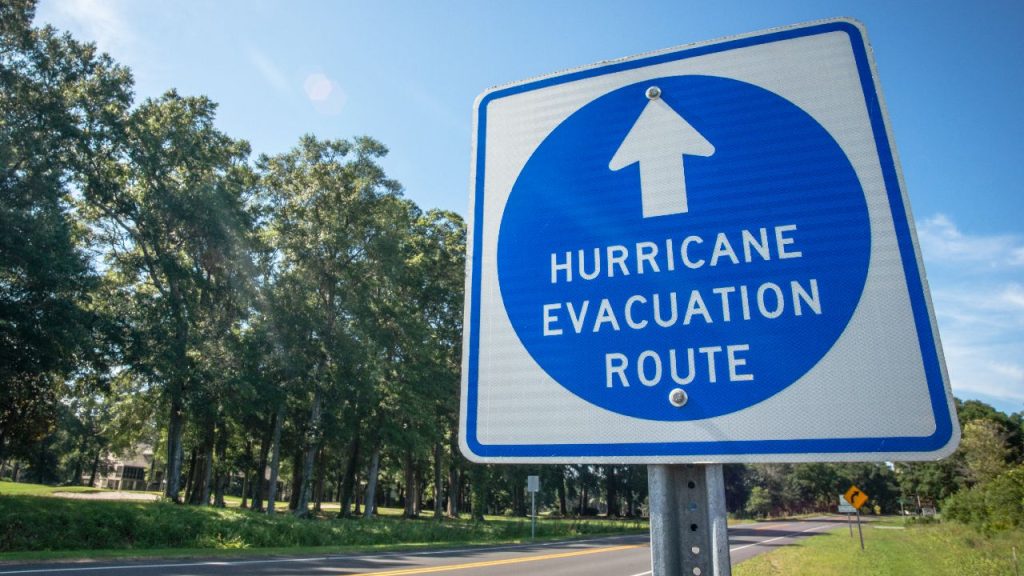
Choose at least three routes out of your area, all going in different directions (e.g. North, South, East). These routes should be along trafficable roads that will not likely be shut down too early prior to landfall. Keep in mind that backroads may be hampered by fallen trees. Also keep in mind that as soon as winds reach 30 – 35 mph, some roads and most bridges will be closed. EMS will also likely stop responding to calls until the storm passes. Map out the rout with landmarks or specific exits along the way. This will also help in coordinating or informing family members as to you current location.
When choosing routes, keep in mind that some states (like Florida) will enact a Counter Flow traffic on interstates and major highways. This is where all traffic lanes will be ONLY used for traffic moving AWAY from the storm. There may be one or two lanes left for traffic moving TOWARDS the storm such as responder vehicles and response assistance coming in from out of the area.
Make an Evacuation Plan
Now is the time, before a storm is threatening, to make a plan for any evacuations. Put the routes you have decided on and include the landmarks and waypoints you created in the previous section. Also include whom you will contact in case you decide to evacuate or are ordered to evacuate. This should be someone that all of your family knows is your central contact and can keep everyone updated on your situation. Also include the criteria you will use to determine when the latest time you can evacuate will be. For example, “I will evacuate no later than (NLT) 12 hours before tropical storm force winds (39 mph) are expected to reach my area”.
Also, research your home’s flood planes and storm surge categories so that you know what level of storm may affect you. You can get this information from your local or county Emergency Management office.
When a Storm is Approaching . . .
When a storm is approaching and has ANY chance of affecting your area, it is time to put your plan into action.
Stay Informed
Monitor the storm information and note when the winds for your area are expected to reach your “trigger” wind speed. Start packing for a 3 – 7 day stay somewhere else. Notify your central contact person that you are making preparations to possibly evacuate. Know what the expected storm surge and flooding will be for your area and when that is likely to occur. Note that flooding may occur during the heavy rains preceding the storm and will likely be exacerbated by the storm surge.
Prepare to Evacuate
Well before the storm is a threat, you should start making preparations to leave. Fill up your gas tanks (all vehicles), pack your evacuation bag, take enough medications with you for at least 7 days. If you have children, identify any favorite toys, games, or stuffed animals that will help them cope.
Based on the path of the storm, you may need to alter one of your routes slightly to make it safe. You should evacuate at a right angle to the storm in a direction that can get you at a safe distance.
Also, this is a good time to look at the shelters that are opening in your area as a backup plan to evacuating. If you have pets, make sure to identify the closest Pet Friendly shelter. Pet friendly shelters will NOT take care of your pet for you. They will only have facilities to house them. You will need to bring your own food, toys, blankets, and usually you own cage or travel crate. You will also have to feed them and walk the when needed. Make sure to have small bags to pick up any messes.
Know When the Storm Will Make Landfall and Where
Monitor the storm’s track and keep an eye on the Storm Surge, Hurricane, and Tropical Storm Watches and Warnings.
| Type | Watch | Warning |
| Tropical Storm | 48 hours before 39 mph winds | 36 hours before 39 mph winds |
| Hurricane | 48 hours before 74 mph winds | 36 hours before 74 mph winds |
| Storm Surge | 48 hours before inundation | 36 hours before inundation |
Remember that the storm track is just an estimate of where the storm might go in the next few days. the further the prediction moves into the future, the less precise the predicted path will be. Don’t just look at the white ice cream cone to determine if it will threaten you, look on both sides of the path to see if it will even come close.
Know the Expected Flooding and Winds in Your Area
Using the watches and warnings and any flooding predictions, determine how much flooding you will possible see. Also try to get an idea what wind speeds you will see in your area. All of this information will help you to determine if you can shelter in place or you need to evacuate. If you are ordered to evacuate by your local or county Emergency Management office, evacuate. Otherwise you will likely be under water and EMS will not be able to respond for possibly days.
Before It’s Too Late . . .
Using your evacuation plan and the current and predicted situation, determine when your NLT time is for you to safely be able to evacuate. It is a good idea to give yourself a few hours buffer so that any unforeseen circumstances (they WILL happen) don’t put you behind the curve and force you to pull off somewhere and ride out the storm..
Know the Traffic Situation and How Long It Takes to Get Out
If there are more people than trying to evacuate the area, your evacuation time will likely be extended. Listen to the newscasts for congested evacuation routes. You may have to alter your planned routed based on congestion and roads or bridges that are unusable. If you live in an area where you have to cross a bridge to get out to safety, you should plan to evacuate WELL before normal to make sure the bridges are usable when you leave.
Pick a Route and Destination
Remember, the best route to evacuate on would be at a right angle to the path of the storm. For example, if the storm were moving North towards your area, you should evacuate to the East or West depending on which can get you to a safer distance, If the storm is moving to the East or West, you should evacuate to the North or South. Understand that as a hurricane approaches land, it will possible be drawn to the land and change its course slightly, veering towards the land. If a storm is approaching from the south and is passing close to land, you may need to have a route that is a little more Southeast.
Also have a planned destination in mind. Don’t just evacuate. If you know you will be evacuating, you can try to make hotel or motel reservation well in advance or coordinate with a friend or relative. Don’t just evacuate into the path of the storm.
L E A V E ! ! !
When you reach your trigger time, and preferably well before, if you are evacuating or are ordered to do so, LEAVE. You should have been preparing to go well before this time and delaying will only put you in possible danger.
If circumstances make it so that you cannot safely evacuate, this is the time to go the the shelter in your area that you researched.

